Measurement & P&L
How to Set Up Blended ROAS and MER Tracking (So the Scorekeeper Stops Being the Player)
Monday, 9:04 a.m.

Monday, 9:04 a.m. The growth lead has three tabs open before coffee. Meta Ads Manager: 4.1x ROAS. Google Ads: "strong performance, exceeding target." The TikTok rep's Slack message from Friday, still cheerful: "great week, campaign's finding its legs." Three platforms, three green numbers, three pats on the back.
Then the fourth tab. The P&L. Flat. Not down, not up. Flat, the way a number is flat when nothing is actually being said about it.
This repeats at every $30M+ DTC brand running paid media across more than one platform. Each platform scores itself, by its own rules, and hands itself the win. Meta counts a sale if someone saw an ad and bought inside a window it defines. Google counts the same sale under its own rules. TikTok counts it too, if its pixel got near the journey. Add the three wins together and you can clear more revenue than the store actually did that week. Nobody lied. Everybody graded in their own favor, and nobody checked the math against anyone else's.
The fix is not a new dashboard. It is one number, computed from data you already own, that no platform can inflate: blended ROAS, reconciled to your GA4 and your P&L. Five steps. No purchase required.
Blended ROAS and MER answer the same question in two accents
Blended ROAS is total revenue divided by total ad spend, across every channel, for a period. A hypothetical brand spends $400,000 across Meta, Google, and TikTok in a month and generates $2,000,000 in revenue. Blended ROAS is 5.0. One number, and no platform gets to claim its slice separately.
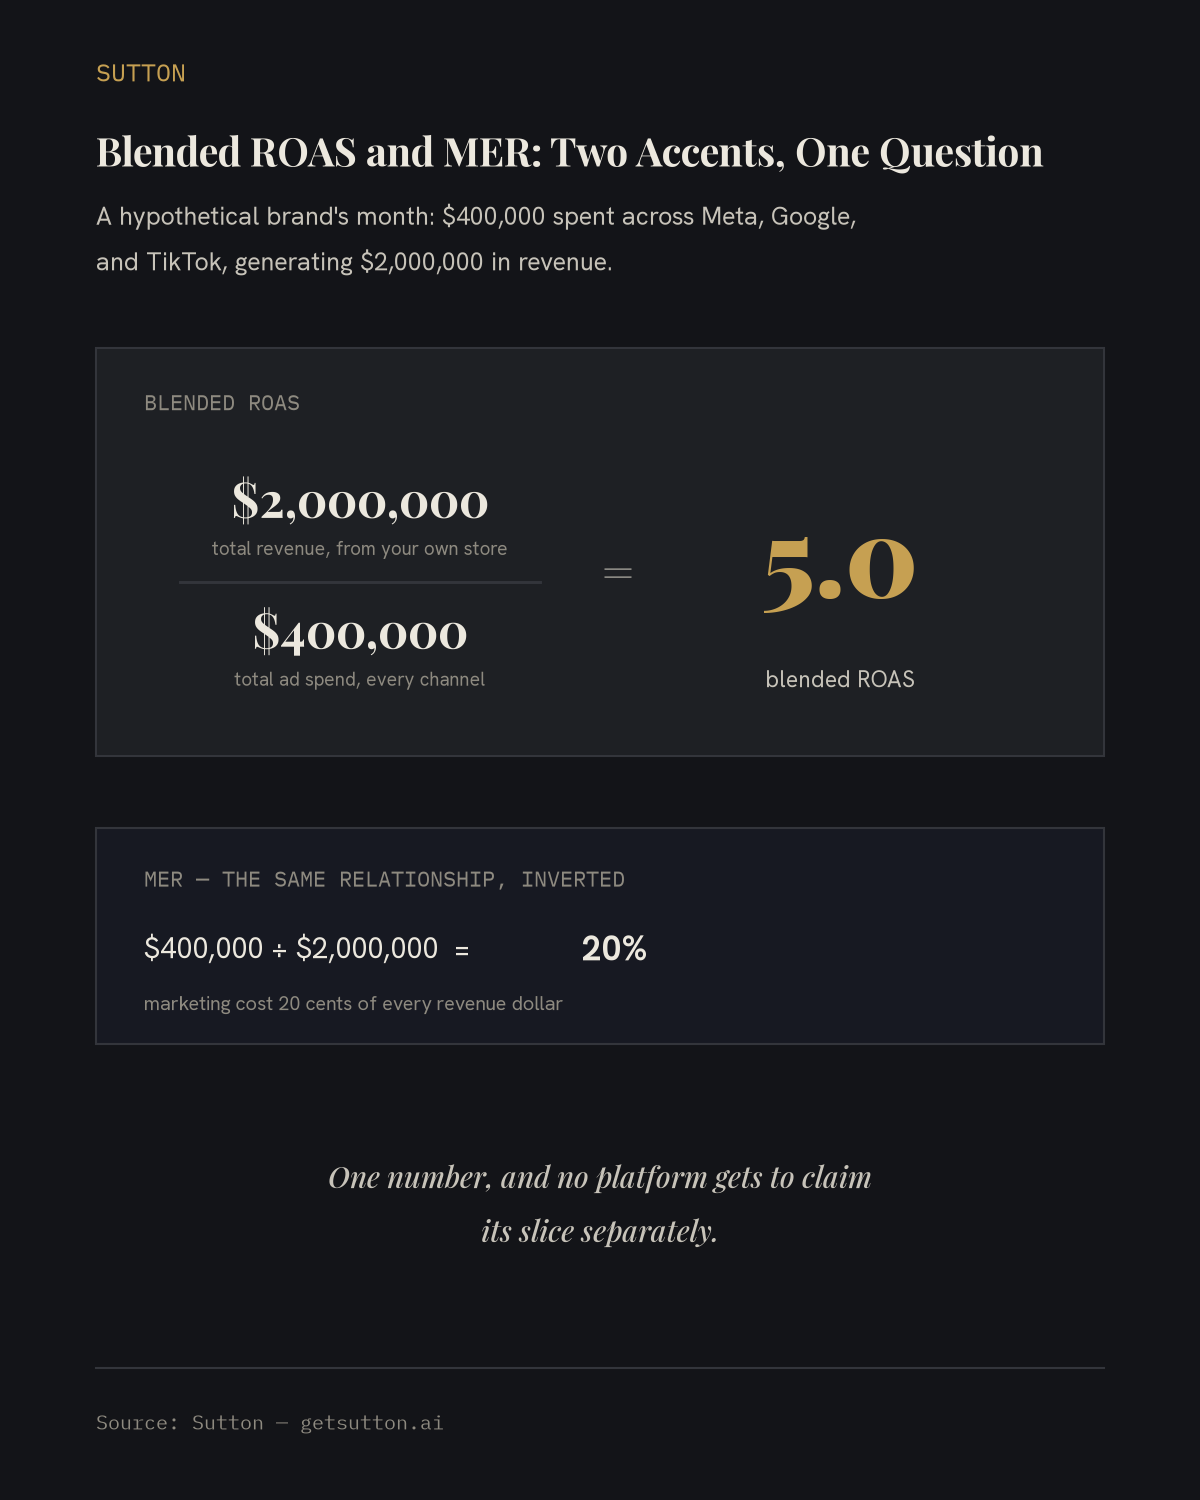
MER, marketing efficiency ratio, is the same relationship the other way: total spend divided by total revenue. The same figures give an MER of 20%, meaning marketing cost 20 cents of every revenue dollar. Some operators invert it and still call the result MER, so check which convention a source uses before comparing across teams.
Both exist because a single platform's ROAS cannot answer the question that matters: is the whole machine working? Meta can only tell you about Meta. It has no idea whether the customer also saw your Google retargeting ad, or typed your brand name into a search bar after two weeks of thinking about you. Blended ROAS does not care which channel gets the credit. It asks whether the money you spent, all of it, produced the revenue you got, all of it.
Cody Plofker, who runs growth at Jones Road Beauty, put it as plainly as it gets: "Blended metrics are truth, attribution is subjective." That is the whole argument in six words. Attribution is a story each platform tells about itself. Blended is the number that doesn't need a story.
The five-step setup
An exercise you can run in a spreadsheet this week, accurate as long as you keep feeding it the right inputs.
Step 1: Define the numerator and denominator so no self-attributed number sneaks in.
Write down the two things you are going to divide: total revenue (from your own store, not any ad platform) and total spend (every dollar you paid to run marketing, not just media cost). This sounds obvious until you watch a blended calculation break. Someone adds Meta revenue plus Google revenue plus TikTok revenue, not realizing each figure already claims some of the same purchases. A customer clicks a Meta ad Tuesday, sees a Google retargeting ad Wednesday, buys Thursday. Both dashboards count that sale. Sum the self-reported numbers and the total runs larger than the store took in. Curtis Howland, a DTC growth consultant, has the blunt version: "Every platform is grading its own homework. And every platform gives itself an A+." The fix is not a smarter attribution model. It is refusing to let any platform's self-reported revenue into the calculation.
Step 2: Pull total revenue from a source you own.
Your revenue number comes from Shopify, your order management system, or GA4's ecommerce reporting, whichever you treat as the store's system of record. Not from an ad platform's conversion tracking. Teams cut corners here because exporting order data is more annoying than screenshotting a dashboard, and it matters most: every downstream number inherits its honesty.
Step 3: Sum all marketing spend, including the fees.
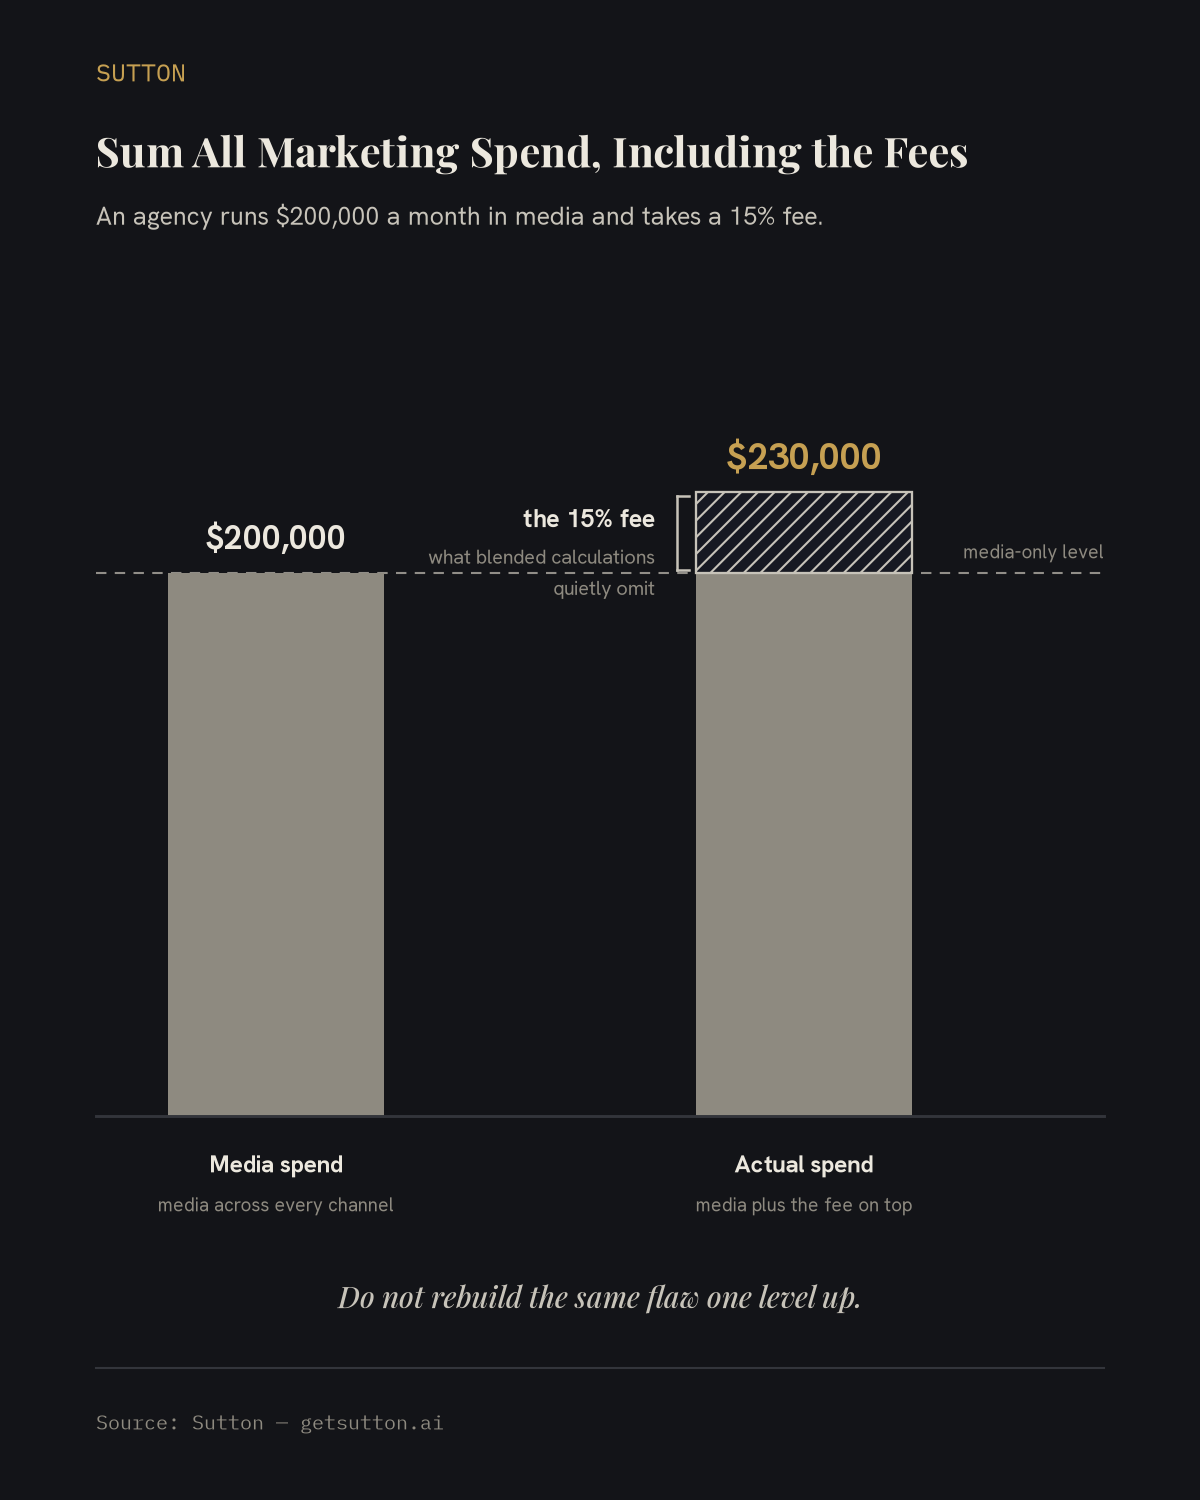
Add media spend across every channel. Then add what blended calculations quietly omit: agency retainers, tool subscriptions, and any percentage-of-spend fee charged on top of the media. If your agency runs $200,000 a month in media and takes a 15% fee, your actual spend is $230,000, not $200,000. Leave the fee out and your denominator understates, your MER looks better than it is, and you have flattered yourself the same way a platform-reported ROAS does. Do not rebuild the same flaw one level up.
Step 4: Reconcile against GA4 and the P&L.
Divide total revenue by total spend for blended ROAS. Divide total spend by total revenue for MER. Now check both against the P&L, the document your CFO already trusts, because it was never built to flatter anyone. If your blended figure and the P&L tell different stories, the P&L wins, every time. Howland again: "When Meta says ROAS is 4x and your P&L says you lost money, your P&L is right."
Step 5: Make it a daily loop, not a monthly report.
A blended MER recalculated once a month, at close, is a postmortem. It tells you what already happened, long after you could act on it. Rebuild the same four steps as a lightweight daily or weekly pull: revenue in from your store, spend in from your ad accounts and fee schedule, one number out. Now a slipping MER shows up on Wednesday, not at month-end, while there is still budget left to redirect. One version you check on. The other checks on you.
"Blended is too blunt. It can't tell me what to cut."
The strongest objection, and a fair one. A single blended number will not tell you whether to kill the TikTok prospecting campaign or double the Google retargeting budget. It is not built to.
That is a division of labor, not a flaw. Blended MER is the scoreboard: whether the whole machine made money this week. In-platform data and incrementality tests are the diagnostic layer, what you use to decide what to change once the scoreboard says something needs changing. You still open Meta's dashboard. You still run a holdout test before cutting a channel. What changes is the hierarchy: platform data is an input to a decision, never the grade.
If you already run an MMM or attribution tool, keep it. The case for blended is not "throw out your tooling." It is that blended is the one number anyone, including a skeptical CFO, can recompute by hand from two figures the company already owns. A black-box model asks for trust. Blended asks for arithmetic.
The number you grade the work on decides what gets optimized
Here is the part that is not really about spreadsheets.
If the entity reporting your performance number profits when that number looks good, the number trends toward looking good, regardless of the P&L. That is not a cynical read of ad platforms. It is what self-grading produces in any system. A platform whose model rewards more spend will always find a story in which more spend worked.
It is the same flaw as an agency paid a percentage of your ad spend. The incentive is not "make your money work harder." It is "spend more," because that is what the fee scales with. Whoever grades the work, and gets paid on the grade, has quiet influence over what the grade says.
That is the discipline behind Sutton: we are graded against the client's own GA4 and MER, the numbers their CFO believes, not the ad platform's self-reported ROAS, because a grade the grader cannot game is the only kind worth trusting with a serious budget. That grading is the encoded judgment of a team that did $150M in DTC sales driving 6 exits across our founding team. The measurement backbone is not a feature bolted on. It is the discipline that made the results real in the first place.
Build the backbone so it cannot lie to you, whoever is running the channels underneath it.
Back to Monday
The same growth lead, a few weeks later. The same three tabs, the same generous green numbers. Nothing about the platforms has changed. They still grade themselves in their own favor. They always will.
But there is a fourth tab now: one blended MER figure, pulled from the store's own revenue and every dollar of actual spend, checked against the P&L that morning. The three dashboards have not gone away. They have been demoted, from verdicts to inputs.
When the CFO asks how the growth number actually looks this month, there is an answer, and it was built, not borrowed.