Measurement & P&L
MER vs ROAS: Why the Platform's Number Is Grading Its Own Homework
It is Monday morning. Two windows are open on the same screen.

It is Monday morning. Two windows are open on the same screen.
The first is Meta Ads Manager, reporting a 4x ROAS for the trailing seven days. The second is the blended revenue number the CFO pulled from the P&L over the weekend. It barely moved. Same period, same spend, two different answers to the same question.
The Head of Growth stares at both. Nothing in the account is broken. The targeting is clean, the creative is fresh, the pacing is normal. Both numbers are working exactly as designed.
That last part is the problem.
The Platform Reporting Your ROAS Is the Party Being Graded
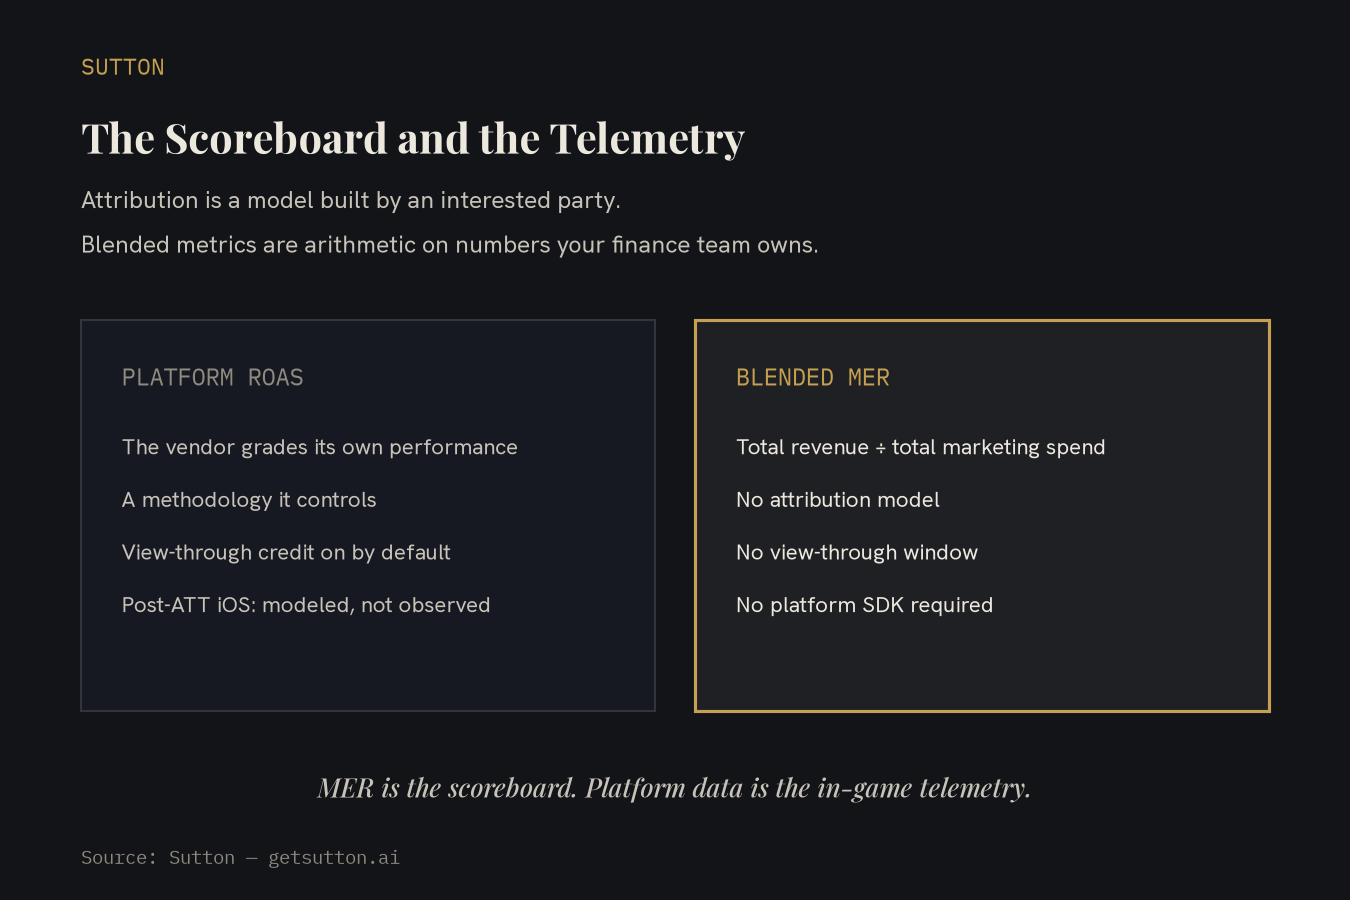
When Meta reports your ROAS, it is doing something structurally strange. It is a vendor, on your spend, grading its own performance, with a methodology it controls and a commercial reason to look good.
This is not a bug. It is the design.
Each walled garden, Meta, Google, TikTok, Pinterest, measures conversions against its own attribution logic. A customer sees a Meta ad on Tuesday. She searches on Google on Wednesday, clicks a branded result, and buys. Meta claims the sale because she saw the ad inside its window. Google claims the sale because she clicked a Google result before checkout. The brand got one order. Two platforms booked it.
Multiply that across every channel at any real budget and the arithmetic falls apart fast. One analysis of 200-plus ecommerce accounts found that when you sum platform-reported revenue across every active channel, the average brand attributes roughly 1.6 conversions per actual order. Every platform is taking credit for everything. Austin Harrison of Northbeam said it plainly from the neutral measurement seat: "You're spending money on TikTok. The TikTok reps are being like, we're driving all your results. And all these people are taking credit for everything."
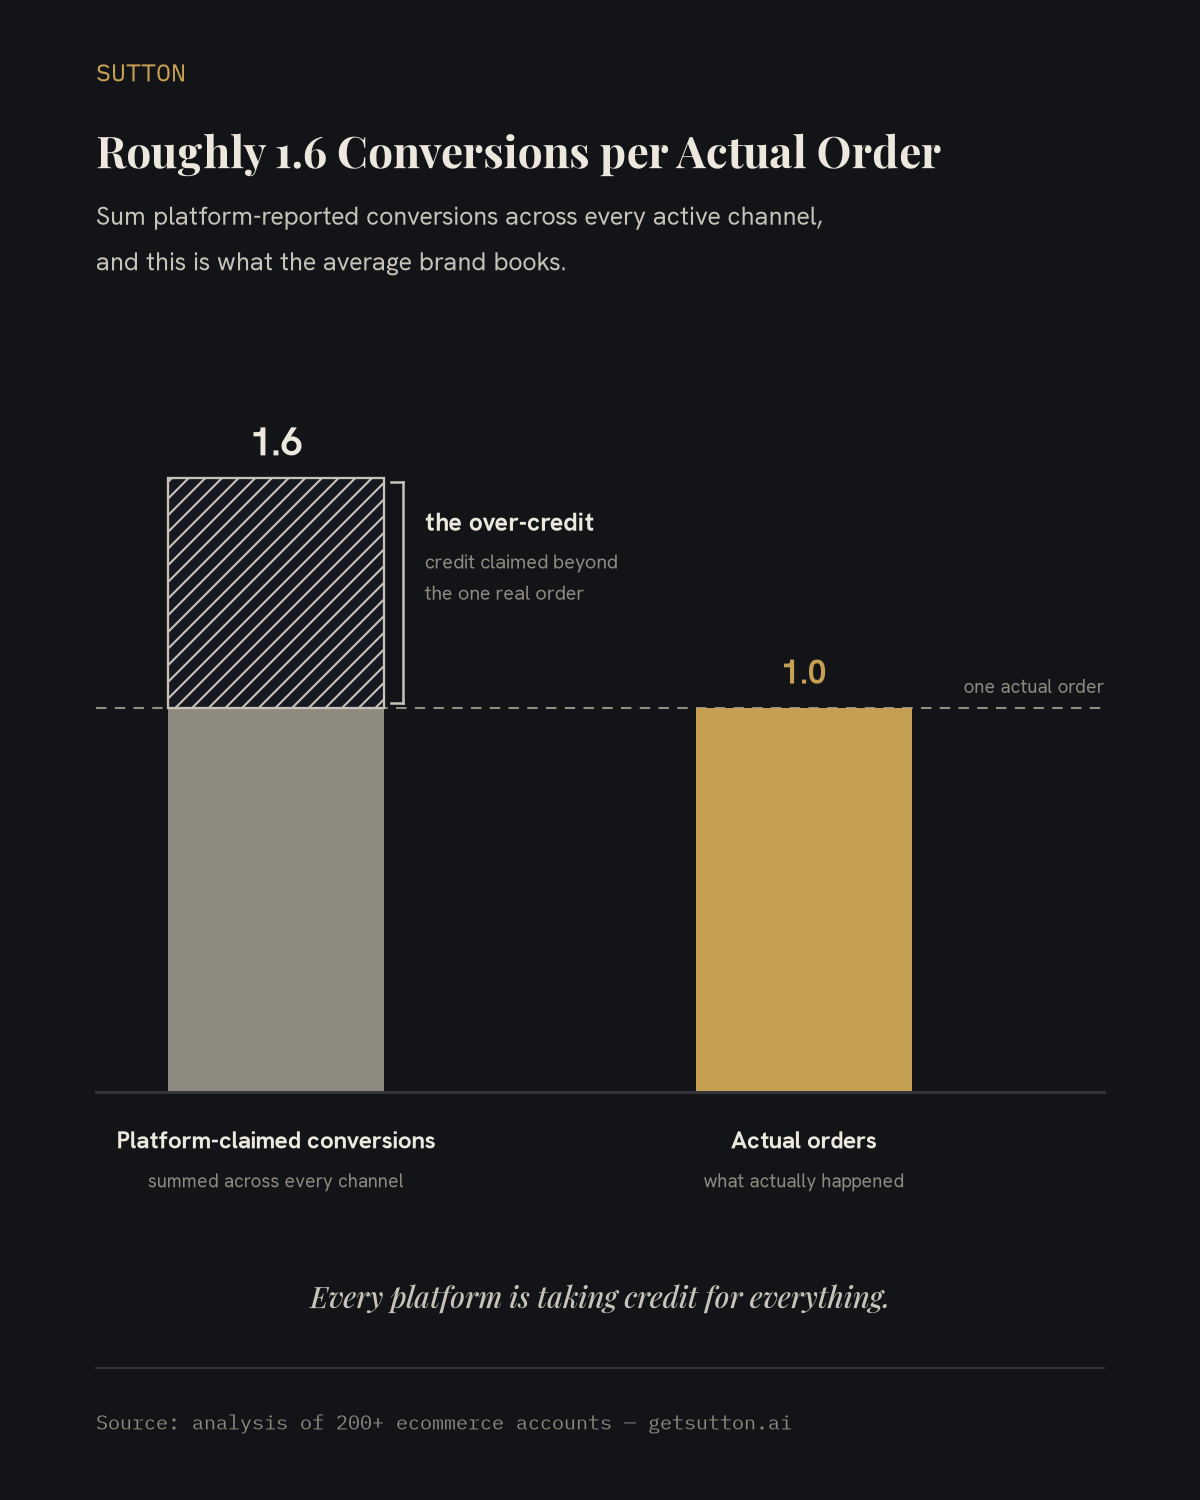
So the platforms are not lying, exactly. Each reports what its own model says, sincerely. The catch is that the models are built to make the platform look good, because a lower reported ROAS would slow spend, and slowing spend slows revenue.
Cody Plofker, at Jones Road Beauty, got there from operating experience: "Blended metrics are truth, attribution is subjective." That is not a dismissal of attribution data. It is a precise read on the relationship between the two. Attribution is a model built by an interested party, and models carry incentive-shaped errors. Blended metrics are arithmetic on numbers your finance team owns.
It runs deeper than double-counting. View-through attribution is on by default in most platforms, crediting people who saw an ad, never clicked it, and bought later through a different channel entirely. That organic or branded purchase gets absorbed into the paid bucket. Then there is the post-ATT gap: with most iOS users opted out of tracking since 2021, a large share of reported iOS conversions are probabilistic estimates, not observed events. The platform is modeling what it cannot see, and adding those guesses to your ROAS.
Better modeling of a self-graded exam is still a self-graded exam.
What MER Actually Is, and Why It Is Harder to Game
MER is one number over another. Total revenue for the period, divided by total marketing spend for the period. No attribution model. No view-through window. No platform SDK required. Just the revenue that hit your Shopify dashboard, divided by what you spent to get it.
Sean Frank, CEO of Ridge, is direct about what that buys you: "I think MER is the gold standard you should be measuring your business on." The gold-standard claim is not that MER is the most diagnostic number. It is that MER is the most honest one. A platform cannot inflate it, because a platform does not control the numerator.
MER alone is not the whole picture, though. It is a company-level efficiency ratio, and two numbers belong on the dashboard beside it.
The first is nCAC, new-customer acquisition cost. MER tells you how efficiently total spend becomes total revenue. nCAC tells you what growth is actually costing. A brand can post a healthy MER on the back of repeat customers who need almost no paid media to convert. The MER looks great. The growth is flat. nCAC surfaces the gap.
The second is contribution margin: revenue minus COGS, minus shipping, minus fulfillment fees, minus ad spend. This is the number that reaches the bank. ROAS can read healthy while contribution margin goes negative, once discounts and returns move against you and fulfillment eats the rest. Frank ties the two together: "When I talk about margin, I really talk about the contribution margin." Plofker ranks it the same way, net profit and contribution margin first.
Curtis Howland has the plainest version of the case: "MER and nCAC are the only metrics that can't lie to you." They cannot lie for a simple reason. Neither one is produced by a party with a reason to inflate it.
Where the Platform Number Still Earns Its Keep
Platform data is not useless. Demoting it to the right role does not mean throwing it out.
Inside a channel, at the campaign and ad-set level, platform-reported ROAS is directionally useful for relative comparisons. If two creatives run under identical targeting and one reports twice the ROAS of the other, that signal is real, even when the absolute number is overstated. The platform overcounts both equally, so the ratio holds. The same logic covers audience comparisons, dayparting, and placement calls. Platform data is a within-channel signal. It stops being useful the moment you treat it as cross-channel truth.
The discipline that separates the two is incrementality: knowing not what correlated with a sale, but what caused it. Above roughly $10M in media spend, geo-holdout tests and conversion-lift experiments are the only honest way to answer what your MER would do if a channel went dark. Rules-based attribution tells you who got touched before a purchase. Incrementality tells you whether that touch changed the outcome.
The test that breaks the most confident platform numbers is the branded-search line item. Branded search tends to report among the highest ROAS of any channel, because people typing your brand name already mean to buy. Last-touch credits the keyword with the sale. What a geo-holdout shows, brand after brand, is that those customers were converting regardless of whether you bought the keyword. The channel looks best on the dashboard and adds least to incremental revenue. That is the attribution gap at its sharpest.
One objection deserves a straight answer: attribution has improved since 2021. CAPI, Enhanced Conversions, and modeled measurement all narrowed the signal loss ATT opened up. On the technical facts, that objection is correct. The tooling got better. But better tooling did not touch the underlying incentive. The platforms with the best measurement stack still have a commercial interest in reporting numbers that keep spend flowing, so better models pointed at that incentive still produce systematically favorable outputs.
The second serious objection is that blended MER is too coarse to act on. You cannot pause a campaign against a company-level ratio. Also true. The answer is not to swap platform data for MER, it is to rank the two correctly. MER is the scoreboard. Platform data is the in-game telemetry. You calibrate the telemetry against the scoreboard, never the reverse. Tony Chopp, in the measurement space, puts it well: measurement's job is "to create a shared reality that allows us to make decisions at speed," not to find an absolute ground truth. MER is that shared reality. Attribution is a working tool inside it, not the source of it.
So the measurement stack that survives a CFO's scrutiny looks like this: an MER target set against a contribution-margin floor, nCAC tracked against your growth ambition, and platform data used as directional signal inside each channel, calibrated periodically against a geo-holdout or lift test that tells you how much of it is real.
Grading Your Growth on the Two Numbers No Channel Can Mark Up
The operational change here is not complicated. Set an MER target, derived from your contribution-margin floor, the minimum blended efficiency at which the P&L stays healthy. Let that be the scorecard you carry to your CFO, because it is the one your CFO can verify without you. If you run a performance agency, that MER target should be the accountability metric in the relationship too, not platform-reported ROAS, which neither of you can honestly be held to because neither of you controls the model behind it.
The person defending a number to a CFO and the person managing the platform accounts have to answer to the same metric. When they answer to different ones, the growth function is keeping two parallel scorecards and hoping they stay close enough to avoid questions. They will not stay close enough for long.
This is the argument Sutton is built around. I grade myself against your own GA4 and MER, the numbers your CFO already believes, not the ad platform's self-reported ROAS. The founding team behind Sutton did $150M in DTC sales driving 6 exits, and we lived on the P&L side of exactly this gap: watching a platform report a win while the finance number said otherwise, and learning to trust the blended number because it was the one that survived diligence. The measurement commitment is not a feature. It is the encoded lesson.
The Scoreboard Stays the Scoreboard
Same growth leader. Monday morning. Same two windows.
The Meta number is still there. The 4x is still there. She uses it for what it is: directional signal inside the channel, useful for comparing creative and audience, calibrated last quarter against a geo-holdout that told her how much of it is real.
The blended number is the one she reports. The one the CFO tracks. The one that survived diligence.
The dashboard did not go away. It just stopped being the scoreboard.